
Setting Up Ghidra & Importing Binaries
Why Ghidra for Malware Analysis?
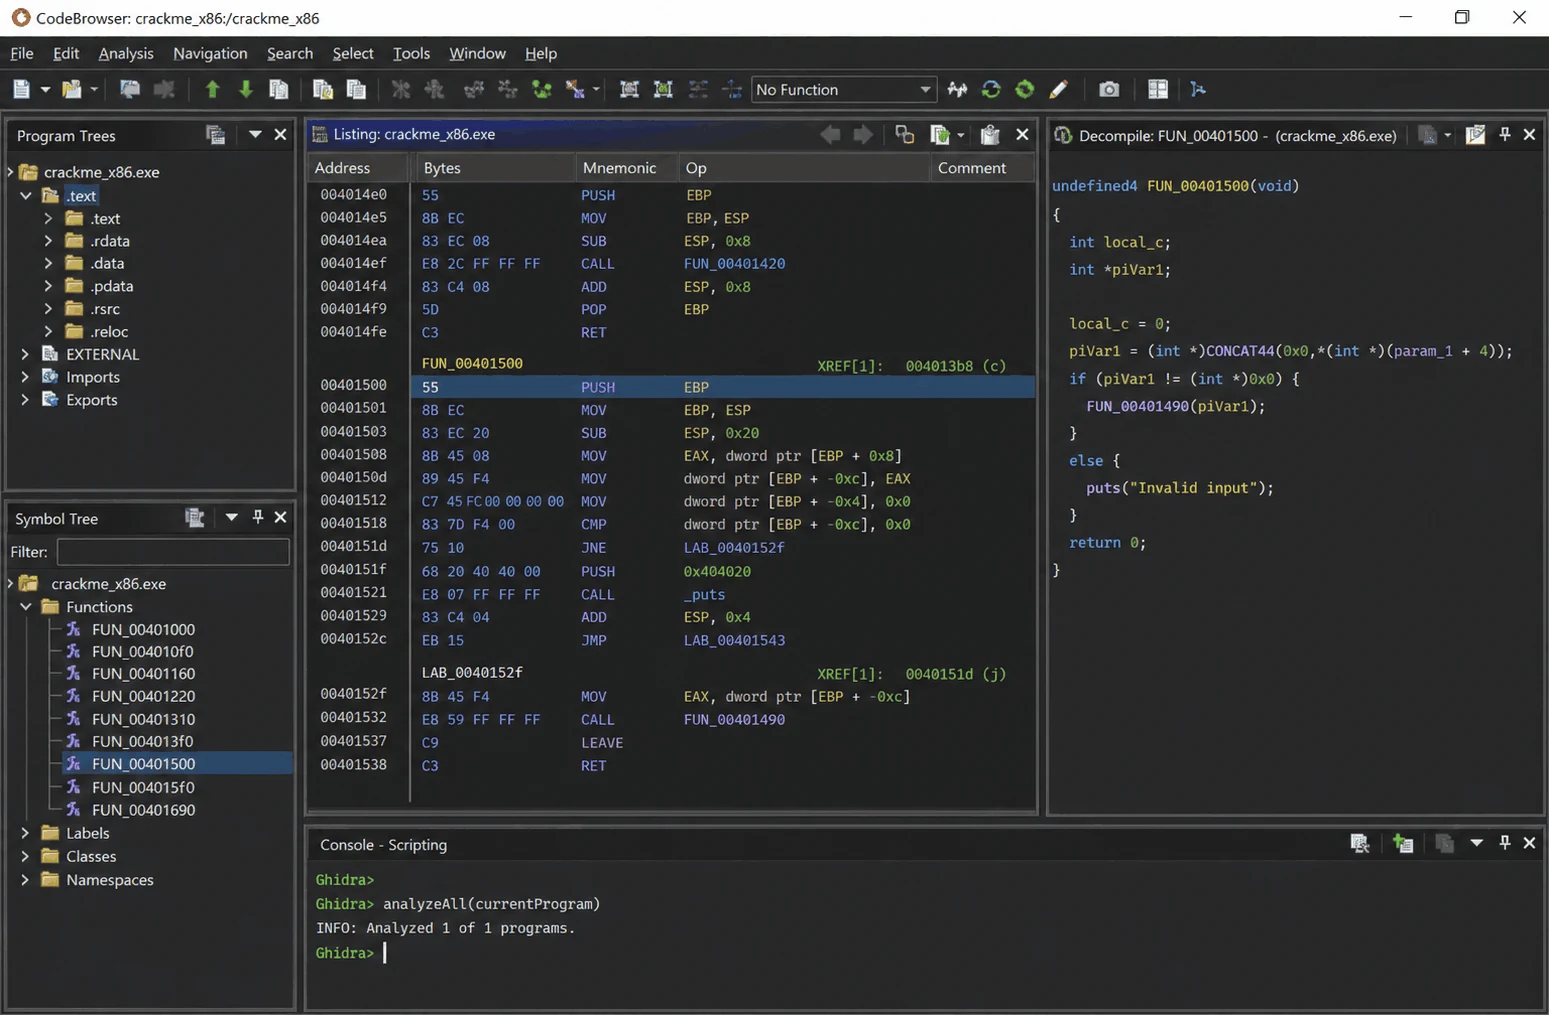
Ghidra is the NSA-released open-source Software Reverse Engineering (SRE) framework. It provides a full-featured disassembler, decompiler, and scripting engine that rivals commercial tools like IDA Pro at zero cost. For malware analysts, Ghidra enables static code analysis of suspicious binaries without executing them, which is the foundation of safe, deep reverse engineering.
Ghidra supports:
- x86, x64, ARM, MIPS, and many other processor architectures
- PE, ELF, Mach-O, raw binary, and dozens of other formats
- Decompilation to C-like pseudocode for faster comprehension
- Annotation and collaboration through shared projects
- Scripting in Java and Python (via Jython) for automation
Analyst Tip: Ghidra is not a sandbox or a debugger. It performs purely static analysis -- reading the bytes on disk without executing the binary. Pair it with a dynamic analysis environment (REMnux, FlareVM) for a complete workflow.
Installation and First Launch
Prerequisites
| Requirement | Details |
|---|---|
| Java | JDK 17 or newer (not JRE) |
| RAM | 4 GB minimum, 8 GB recommended |
| Disk | ~1 GB for Ghidra + project space |
| OS | Windows, Linux, or macOS |
Installation Steps
- Download the latest release from ghidra-sre.org
- Extract the ZIP archive to a location of your choice (no installer required)
- Launch Ghidra:
- Windows: Double-click
ghidraRun.bat - Linux/macOS: Run
./ghidraRunfrom a terminal
- Windows: Double-click
- On first launch, Ghidra may prompt you to specify your JDK path -- point it to the
bindirectory of your JDK installation
Common Pitfall: If Ghidra fails to launch, verify that
java --versionreports JDK 17+. A frequent mistake is having an older JRE on the system PATH instead of the required JDK.
Creating a Project
Ghidra organizes all analysis work into projects. A single project can hold many binaries and preserves all your annotations, renamed functions, comments, and bookmarks.
Steps to Create a New Project
- From the Ghidra Project Window, go to File > New Project
- Choose Non-Shared Project (local analysis -- the standard choice)
- Select a project directory and give it a descriptive name (e.g.,
Case_2024_Ransomware_Triage) - Click Finish
The project window now appears, showing a folder-like view where imported binaries will live.
Project Organization Best Practices
| Practice | Rationale |
|---|---|
| One project per investigation | Keeps unrelated analyses separate |
| Name projects with case IDs | Easy to locate months later |
| Use folders within projects | Group related binaries (dropper, payload, DLL) |
| Save frequently | Ghidra does not auto-save annotation work |
Importing a Malware Binary
Import Workflow
- In the project window, go to File > Import File (or press
I) - Select the malware sample from disk
- Ghidra displays the Import Results dialog showing:
- Format: PE (Portable Executable), ELF, Mach-O, or Raw
- Language: x86, x64, ARM, etc., with compiler specification
- Warnings: Any issues detected during import parsing
- Review the detected format and language -- Ghidra auto-detects these correctly for standard PE and ELF binaries
- Click OK to add the binary to the project
Import Options Reference
| Option | When to Use |
|---|---|
| Auto-detect format | Default -- works for standard PE, ELF, Mach-O files |
| Raw Binary | Shellcode blobs, memory dumps, firmware extracts |
| Batch Import | Importing multiple files at once (e.g., malware + all its dropped DLLs) |
| Language override | When Ghidra misdetects architecture (rare for PE) |
What Happens During Import
Ghidra parses the binary's header structures to identify:
- Sections (
.text,.data,.rdata,.rsrc) - Import Address Table (IAT) -- DLLs and functions the binary calls
- Export table -- functions the binary exposes (relevant for DLLs)
- Resources -- embedded icons, strings, manifests, or payloads
- Entry point address -- where execution begins
Auto-Analysis: The Critical First Step
When you double-click an imported binary to open it in the CodeBrowser, Ghidra prompts:
"Would you like to analyze this program?"
Always click "Yes" to run auto-analysis. This is where Ghidra transforms raw bytes into navigable disassembly and decompiled code.
Key Analyzers to Understand
| Analyzer | Purpose | Impact |
|---|---|---|
| WindowsPE x86 Propagate External Parameters | Applies parameter names from Windows API definitions to call sites | Turns cryptic param_1 into meaningful names like lpFileName |
| Decompiler Parameter ID | Propagates data types through the decompiler | Dramatically improves decompiler output quality |
| Function ID (FID) | Matches known library function signatures | Identifies standard C runtime functions so you can skip them |
| Aggressive Instruction Finder | Locates code that linear disassembly missed | Finds functions not reached via normal control flow |
| Stack Analysis | Tracks stack variable allocation and usage | Enables accurate local variable identification |
| Create Address Tables | Detects jump tables and virtual function tables | Improves switch statement and C++ analysis |
Analysis Configuration Tips
- Accept the defaults for standard PE analysis -- they cover 95% of cases
- For 64-bit binaries, ensure the language is set to
x86:LE:64:default - Analysis time varies: small binaries finish in seconds, large ones (5+ MB) may take several minutes
- Watch the progress bar at the bottom right of CodeBrowser -- do not start annotating until analysis completes
Analyst Tip: If the decompiler output looks poor after auto-analysis, try running Analysis > One Shot > Decompiler Parameter ID again. Occasionally a second pass improves results after the first pass discovers more functions.
Verifying Your Setup
After auto-analysis completes, verify that Ghidra processed the binary correctly by checking these four windows:
| Window | What to Verify |
|---|---|
| Symbol Tree > Imports | Lists DLLs (kernel32.dll, ws2_32.dll, etc.) and their imported functions |
| Listing (center) | Shows disassembled instructions with addresses, mnemonics, and operands |
| Decompile (right) | Displays C-like pseudocode for the selected function |
| Program Trees | Shows the PE section layout (.text, .data, .rdata, .rsrc) |
Quick Verification Checklist
- Symbol Tree > Imports shows at least one DLL with imported functions
- Clicking a function in the Symbol Tree navigates the Listing view to that function
- The Decompile window shows pseudocode (not an error message)
- The Functions list (Symbol Tree > Functions) contains discovered functions
- The Program Trees panel shows the expected PE sections
Saving Your Work
Ghidra does not auto-save your annotations. After making progress:
- Press
Ctrl+Sto save the program database - When closing a project, Ghidra will ask if you want to save unsaved changes
- For important analyses, use File > Save As to create backup copies
Common Pitfall: Losing hours of annotation work because you forgot to save. Build a habit of pressing Ctrl+S after every significant rename or comment addition.
Practical Exercise
- Download a benign PE executable (e.g.,
notepad.exefromC:\Windows\System32) or a PMA Lab sample - Launch Ghidra and create a new Non-Shared Project named
RE_Practice_01 - Import the binary using File > Import File
- Accept auto-analysis defaults and wait for analysis to complete
- Verify: navigate the Symbol Tree, check Imports, browse the Listing and Decompile views
- Locate the entry point by double-clicking
entryin the Symbol Tree - Save the project with Ctrl+S