
Process Monitoring with Procmon
Process Monitor (Procmon) is the single most important tool in Windows dynamic malware analysis. It captures real-time file system, registry, network, and process/thread activity at the kernel level, providing a complete trace of everything a program does on the system.
1. How Procmon Works
Procmon operates through a kernel-mode driver that hooks into the Windows kernel notification mechanisms:
| Data Source | Kernel Mechanism | What It Captures |
|---|---|---|
| File system | File system filter driver (minifilter) | Every file open, read, write, delete, rename |
| Registry | Registry callback (CmRegisterCallbackEx) | Every key open, value read, value set, key create/delete |
| Process/Thread | Process/thread callbacks (PsSetCreateProcessNotifyRoutine) | Process creation, thread creation, image loads |
| Network | Windows Filtering Platform (WFP) | TCP/UDP connection attempts (limited detail) |
Because Procmon works at the kernel level, malware cannot hide its operations from it (unless it also has kernel-level access). This is why it is the preferred monitoring tool.
Key insight: Procmon captures attempted operations too, including failures. A failed
RegOpenKeytells you the malware tried to read a registry key that does not exist -- which is still valuable intelligence.
2. Operation Types Reference
File System Operations
| Operation | What It Means | Malware Relevance |
|---|---|---|
| CreateFile | Opens or creates a file/directory | Dropping payloads, opening configs |
| WriteFile | Writes data to a file | Payload installation, data exfiltration to file |
| ReadFile | Reads data from a file | Reading configs, stealing documents |
| CloseFile | Closes a file handle | End of file operation |
| DeleteFile | Deletes a file | Self-deletion, anti-forensics |
| SetRenameInformationFile | Renames/moves a file | Staging payloads, hiding files |
| SetDispositionInformationFile | Marks file for delete-on-close | Stealthy self-deletion technique |
| QueryDirectory | Lists directory contents | Reconnaissance, searching for targets |
Registry Operations
| Operation | What It Means | Malware Relevance |
|---|---|---|
| RegOpenKey | Opens a registry key | Checking for persistence, reading config |
| RegQueryValue | Reads a registry value | Reading installed software, system info |
| RegSetValue | Writes/modifies a registry value | Persistence, config storage, defense evasion |
| RegCreateKey | Creates a new registry key | Establishing new persistence locations |
| RegDeleteValue | Deletes a registry value | Removing traces, modifying security settings |
| RegEnumValue | Enumerates values under a key | Reconnaissance of installed software |
Process Operations
| Operation | What It Means | Malware Relevance |
|---|---|---|
| Process Create | New process started | Spawning child processes, launching payloads |
| Process Exit | Process terminated | Self-termination after payload delivery |
| Thread Create | New thread in a process | Remote thread = process injection |
| Load Image | DLL or EXE loaded into memory | DLL side-loading, reflective loading |
3. Filter Strategies
Procmon captures thousands of events per second from all processes on the system. Without filters, the data is overwhelming. There are four essential strategies:
Strategy 1: Filter by Process Name (Most Common)
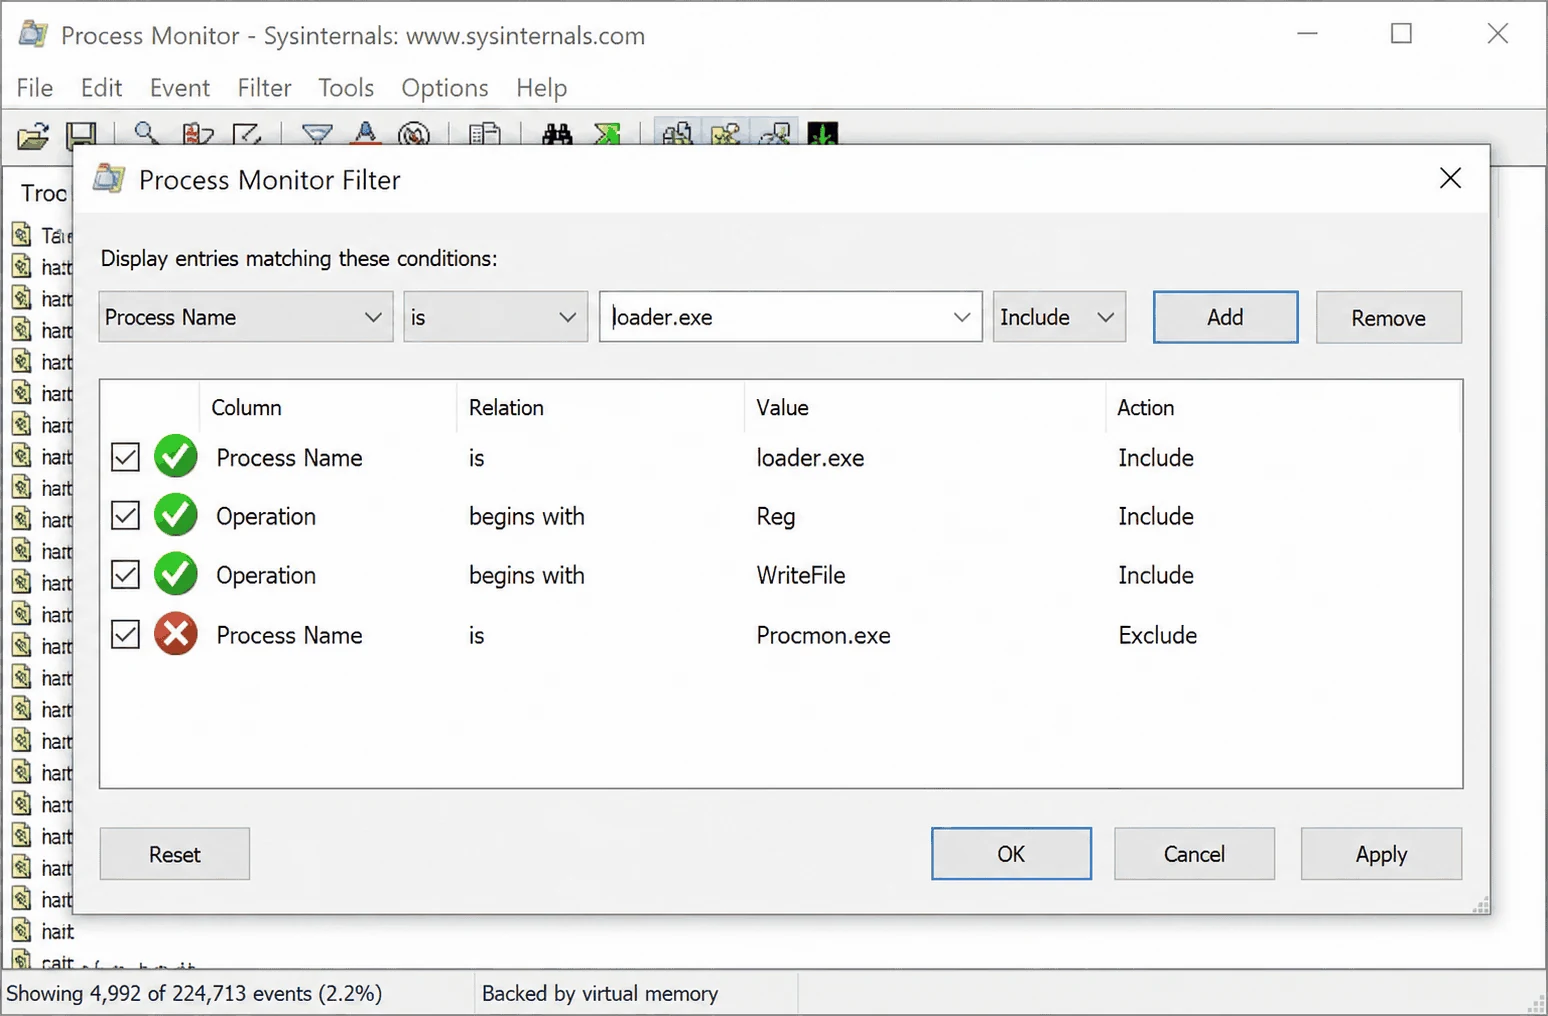
Filter → Filter... (Ctrl+L)
  Process Name | is | suspicious.exe | Include
  [Add]
Limitation: This misses child processes. If malware spawns cmd.exe or powershell.exe, those events are not captured.
Strategy 2: Filter by Process Name + Children (Recommended)
Use the Process Tree feature instead:
1. Run the sample
2. Tools → Process Tree (Ctrl+T)
3. Find the sample in the tree
4. Right-click → Add Process and Children to Include Filter
This captures the sample AND everything it spawns, regardless of name.
Strategy 3: Exclude Known-Good Processes
Instead of including the malware, exclude everything that is NOT the malware:
Process Name | is     | explorer.exe  | Exclude
Process Name | is     | svchost.exe   | Exclude
Process Name | is     | csrss.exe     | Exclude
Process Name | is     | services.exe  | Exclude
Process Name | is     | MsMpEng.exe   | Exclude
Process Name | is     | SearchUI.exe  | Exclude
Process Name | is     | Procmon64.exe | Exclude
Best for: Discovering unexpected processes launched by the malware.
Strategy 4: Filter by Operation Type
Focus on specific behaviors:
# Persistence hunting
Operation | is       | RegSetValue    | Include
Path      | contains | CurrentVersion\Run | Include

# File drops
Operation | is       | CreateFile     | Include
Path      | contains | Temp           | Include

# Process injection
Operation | is       | CreateRemoteThread | Include
Pro Tip: Combine strategies. Start with Strategy 2 (process + children), then add Strategy 4 filters to focus on specific behaviors.
4. Process Tree Analysis
The Process Tree (Ctrl+T) shows the parent-child hierarchy of all processes observed during the capture:
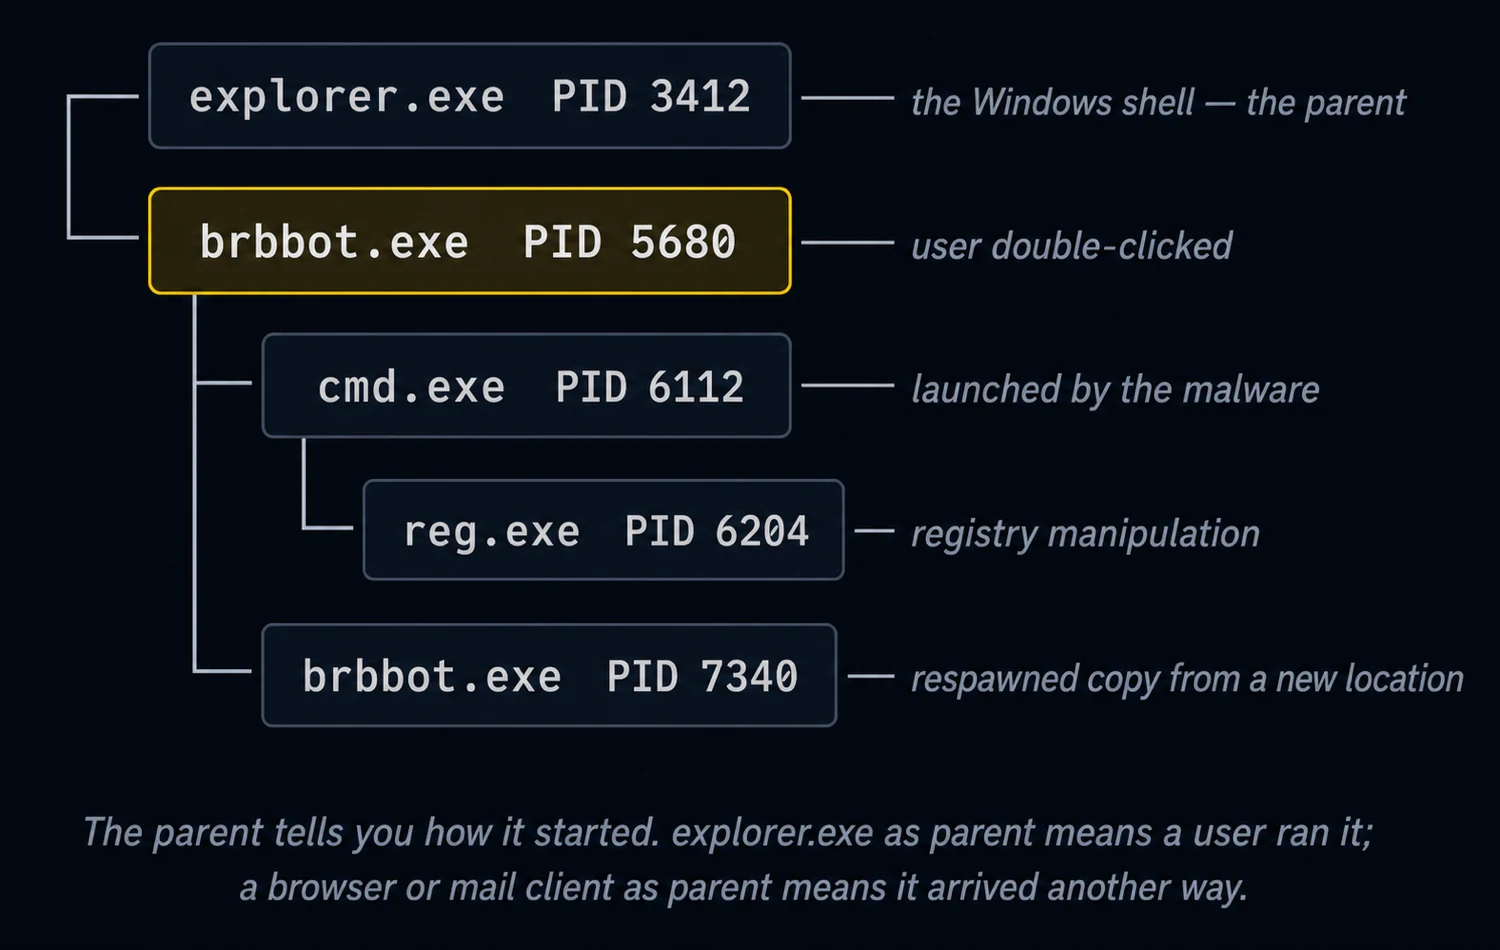
What the Process Tree Reveals
- Execution chain: How the malware propagated from initial execution
- Spawned processes: What tools or scripts the malware launches
- Process replacement: Self-copying and restarting from a new path
- Living-off-the-land: Use of legitimate tools (cmd.exe, powershell.exe, reg.exe, schtasks.exe)
5. Analyzing the Trace: Key Patterns
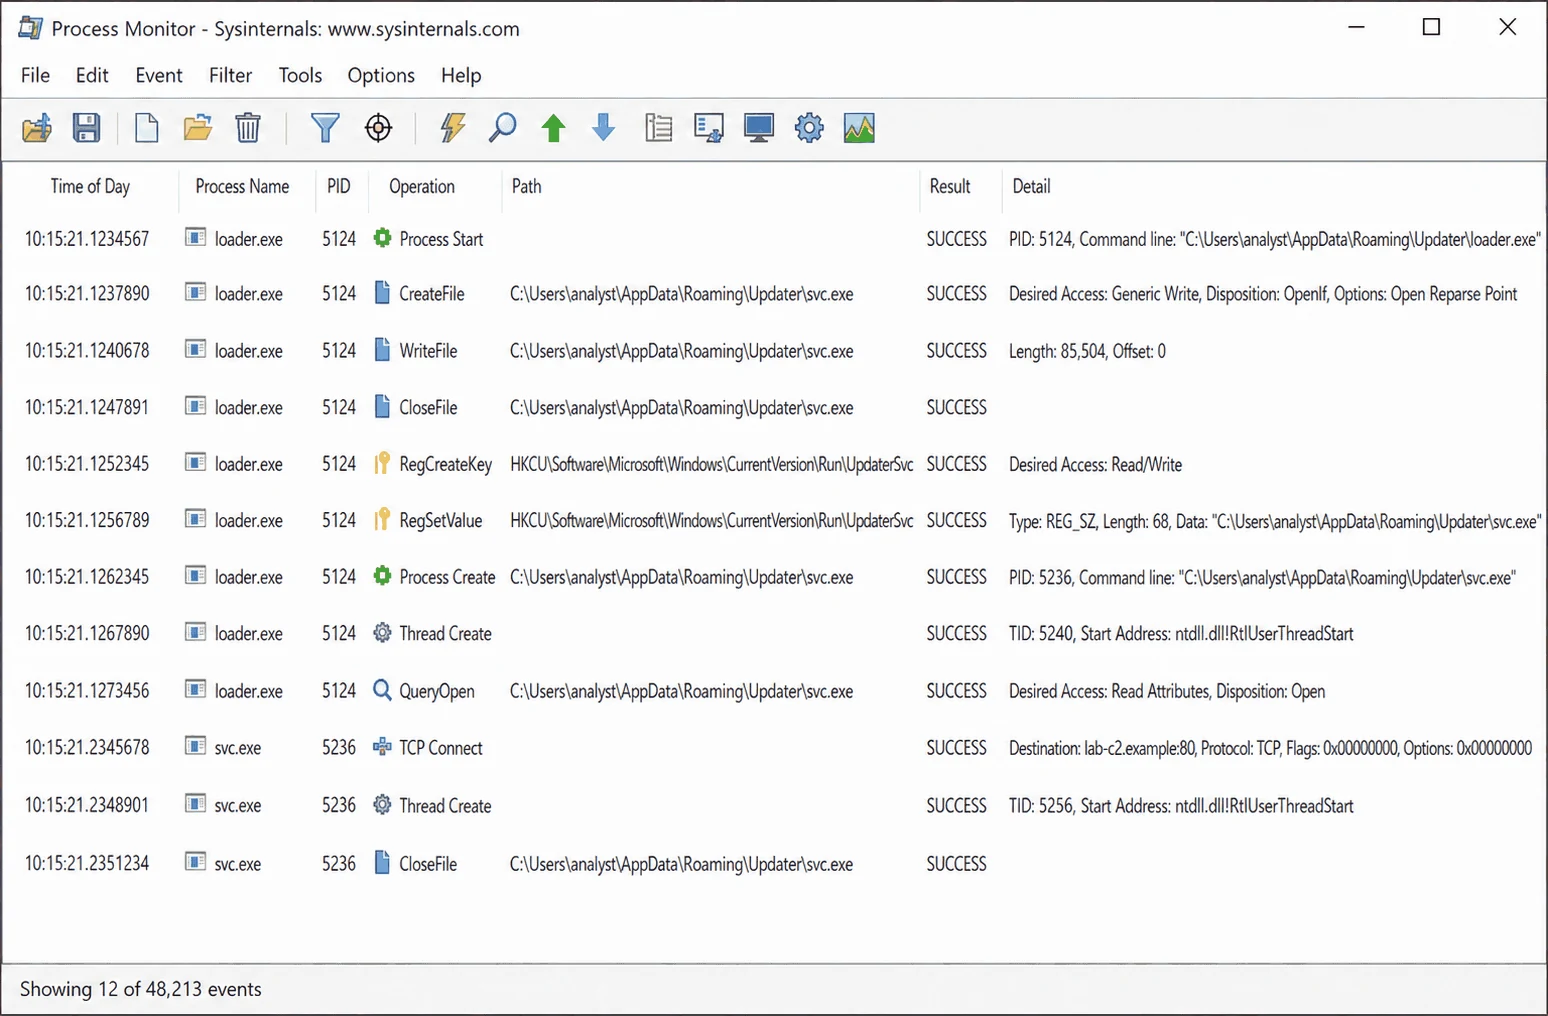
Pattern 1: Payload Dropping
suspicious.exe | CreateFile | C:\Users\user\AppData\Local\Temp\payload.dll | SUCCESS
suspicious.exe | WriteFile  | C:\Users\user\AppData\Local\Temp\payload.dll | SUCCESS
suspicious.exe | CloseFile  | C:\Users\user\AppData\Local\Temp\payload.dll | SUCCESS
Look for: CreateFile followed by WriteFile to %TEMP%, %APPDATA%, %PROGRAMDATA%, or system directories.
Pattern 2: Persistence Installation
suspicious.exe | RegSetValue | HKCU\Software\Microsoft\Windows\CurrentVersion\Run\botnet | SUCCESS
                              Type: REG_SZ  Data: "C:\Users\user\AppData\Local\Temp\payload.exe"
Look for: RegSetValue under any Run key, Services key, or Scheduled Task path.
Pattern 3: Self-Deletion
suspicious.exe | SetDispositionInformationFile | C:\malware\suspicious.exe | SUCCESS
                 Delete: True
Or using a batch file:
suspicious.exe | Process Create | cmd.exe /c ping localhost -n 3 & del "C:\malware\suspicious.exe"
Pattern 4: Process Injection
suspicious.exe | OpenProcess   | explorer.exe (PID 3412) | SUCCESS
suspicious.exe | VirtualAllocEx | explorer.exe            | SUCCESS
suspicious.exe | WriteProcessMemory | explorer.exe        | SUCCESS
suspicious.exe | CreateRemoteThread | explorer.exe        | SUCCESS
Look for: Operations targeting other processes -- this is injection.
Pattern 5: Configuration File Read/Write
brbbot.exe | CreateFile | C:\Users\user\AppData\Local\Temp\brbconfig.tmp | SUCCESS
brbbot.exe | ReadFile   | C:\Users\user\AppData\Local\Temp\brbconfig.tmp | SUCCESS
Look for: Files with .tmp, .dat, .cfg extensions in temp directories.
6. Timeline Analysis with Procmon
Procmon timestamps every event with microsecond precision. Use this to build a behavioral timeline:
1. Set Time of Day column to visible (Options → Select Columns)
2. Sort by Time of Day (ascending)
3. After applying filters, read events chronologically:

10:15:32.001  brbbot.exe  Process Create              ← Malware starts
10:15:32.450  brbbot.exe  CreateFile brbconfig.tmp     ← Drops config
10:15:33.102  brbbot.exe  RegSetValue ...\Run\brbbot   ← Sets persistence
10:15:33.890  brbbot.exe  TCP Connect 10.0.0.1:80      ← C2 callback
10:15:34.200  brbbot.exe  WriteFile brbconfig.tmp      ← Updates config
10:15:35.050  brbbot.exe  Process Create cmd.exe        ← Runs command
7. Saving and Exporting Results
File → Save... (Ctrl+S)

Format options:
- PML (native): Full fidelity, reopen in Procmon later. Best for archiving.
- CSV: Importable into Excel, Python, Splunk. Good for sharing.
- XML: Structured format for programmatic processing.

Tip: Save as PML first (complete data), then export filtered views as CSV.
Common Pitfall: Procmon captures so much data that PML files can grow to gigabytes quickly. Apply filters before long captures, or use the drop filtered events option (Filter -> Drop Filtered Events) to reduce file size.
MITRE ATT&CK: Procmon is essential for observing T1547.001 - Boot or Logon Autostart Execution: Registry Run Keys, T1055 - Process Injection, T1070.004 - Indicator Removal: File Deletion, T1059 - Command and Scripting Interpreter, and virtually every host-based technique.