
Dynamic Analysis Environment Setup
Dynamic analysis -- executing malware in a controlled environment and observing its behavior -- is the complement to static analysis. Where static analysis tells you what malware could do, dynamic analysis tells you what it actually does. This lesson covers sandboxing concepts, two-VM architecture, network simulation, and the complete pre-execution checklist.
1. Sandbox Concepts: Automated vs. Manual
A sandbox is an isolated environment where malware can execute without endangering production systems. There are two fundamental approaches:
| Approach | Description | Strengths | Limitations |
|---|---|---|---|
| Automated sandbox | Submit sample, get report | Fast triage, scales well, good for bulk analysis | May miss behaviors requiring user interaction |
| Manual sandbox | Analyst controls the VM and tools in real-time | Full control, can interact with malware, deeper analysis | Slow, requires expertise, one sample at a time |
Online Automated Sandboxes
| Service | Backend | Key Features | Free Tier |
|---|---|---|---|
| ANY.RUN | Interactive Windows VMs | Real-time process tree, PCAP export, ATT&CK mapping | Public submissions only |
| Joe Sandbox | Multi-platform (Win/macOS/Linux/Android) | Deep behavioral analysis, anti-evasion tech, ML classification | Community edition (limited) |
| Hybrid Analysis | CrowdStrike Falcon Sandbox | YARA matching, detailed indicators, API access | Registration required |
| CAPE Sandbox | Open-source (self-hosted) | Payload extraction, config extraction, memory dumps | Free (self-hosted) |
| Triage | Hatching platform | Fast turnaround, family detection, config extraction | Public submissions |
Important: Public sandboxes make your sample visible to the entire security community. Never submit client-specific or classified samples to public services without authorization. Always search by hash first before uploading.
When to Use Each Approach
- Automated first: Submit to an online sandbox for quick triage. If the report is rich enough, you may not need manual analysis.
- Manual when: The sample detects sandboxes and evades, requires user interaction (clicking dialogs, entering credentials), or you need to understand specific execution paths in depth.
2. Two-VM Analysis Architecture
The professional lab setup uses two virtual machines connected by a host-only network:
+---------------------------+          +---------------------------+
|   Windows Analysis VM     |          |    REMnux Services VM     |
|                           |          |                           |
|  - Procmon                |  host-   |  - INetSim (all services) |
|  - Process Explorer       |  only    |  - fakedns                |
|  - Wireshark              | <------> |  - Wireshark/tcpdump      |
|  - Regshot                |  network |  - Burp Suite / mitmproxy |
|  - x64dbg                 |          |  - REMNUX tools           |
|  - Malware sample         |          |                           |
+---------------------------+          +---------------------------+
      IP: 10.0.0.100                        IP: 10.0.0.1
      Gateway: 10.0.0.1                     (acts as gateway)
      DNS: 10.0.0.1
Why Two VMs?
- Isolation: The Windows VM has no real internet access -- all traffic routes to REMnux
- Full capture: REMnux captures every packet the malware sends
- Service simulation: INetSim on REMnux answers DNS, HTTP, HTTPS, SMTP, and more
- Containment: Malware that stays inside the guest reaches only REMnux, which is logging it. A genuine hypervisor escape is a different class of event and would reach your host -- rare, but the reason the host is treated as in-scope rather than trusted
Windows VM Configuration
- OS: Windows 10/11 (match target environment)
- Network: Host-only adapter, gateway and DNS pointing to REMnux IP
- Snapshots: Clean snapshot taken after tool installation, before any analysis
- Disabled: Windows Defender, Windows Update, automatic sample submission
- Installed tools: Procmon, Process Explorer, Wireshark, Regshot, PEStudio, x64dbg, FakeNet-NG, API Monitor
REMnux VM Configuration
- OS: REMnux (Ubuntu-based, pre-loaded with analysis tools)
- Network: Host-only adapter with static IP (e.g., 10.0.0.1)
- Role: Gateway, DNS server, and network service simulator
3. Network Simulation Tools
INetSim (on REMnux)
INetSim simulates internet services so malware believes it has real connectivity:
# Start INetSim with default configuration
$ sudo inetsim

# INetSim provides:
# - DNS server (responds to all queries with REMnux IP)
# - HTTP/HTTPS server (serves dummy pages)
# - SMTP server (accepts all emails)
# - FTP server (allows uploads/downloads)
# - IRC server (simulates IRC C2)
# - And 10+ more service simulations

# Configuration: /etc/inetsim/inetsim.conf
# Logs: /var/log/inetsim/
# Data directory: /var/lib/inetsim/
fakedns (on REMnux)
Lightweight DNS responder -- responds to every DNS query with a specified IP:
# Respond to all DNS queries with REMnux IP
$ sudo fakedns 10.0.0.1

# Output shows every domain the malware queries:
# Respoding to evil-c2.com with 10.0.0.1
# Respoding to update.microsoft.com with 10.0.0.1
# Respoding to dga-domain-abc123.net with 10.0.0.1
Pro Tip: Use
fakednsfor quick DNS logging. Use INetSim when you need full service simulation (HTTP responses, SMTP, etc.).
FakeNet-NG (on Windows Analysis VM)
FakeNet-NG runs directly on the Windows VM and intercepts all network calls at the OS level:
# Start FakeNet-NG (run as Administrator)
C:\tools\fakenet> fakenet.exe

# FakeNet-NG intercepts:
# - DNS queries (logs domains, responds with localhost)
# - HTTP/HTTPS (logs requests, serves configurable responses)
# - Raw TCP/UDP (logs connection attempts)
# - Custom listeners for any port
When to Use Which
| Scenario | Tool | Reason |
|---|---|---|
| Two-VM setup with REMnux | INetSim + fakedns | Full service simulation on dedicated VM |
| Single-VM quick analysis | FakeNet-NG | All-in-one, runs on Windows |
| Need to see exact DNS queries | fakedns | Lightweight, real-time output |
| Need full HTTP response simulation | INetSim | Configurable response content |
4. Pre-Execution Checklist
Before executing any malware sample, complete every item:
- VM reverted to clean snapshot (mandatory -- never skip)
- Network adapter set to host-only (no NAT, no bridged)
- REMnux services running (INetSim or fakedns)
- Procmon open with filters configured for the sample
- Process Explorer running (for process tree visibility)
- Wireshark capturing on the host-only interface
- Regshot first snapshot taken (for registry/filesystem diff)
- Clipboard cleared (some malware monitors clipboard)
- Time synchronized between VMs (for timeline correlation)
- Sample staged in known location (e.g., C:\malware\sample.exe)
5. Tool Launch Order
Order matters because you want all monitoring active before the malware runs:
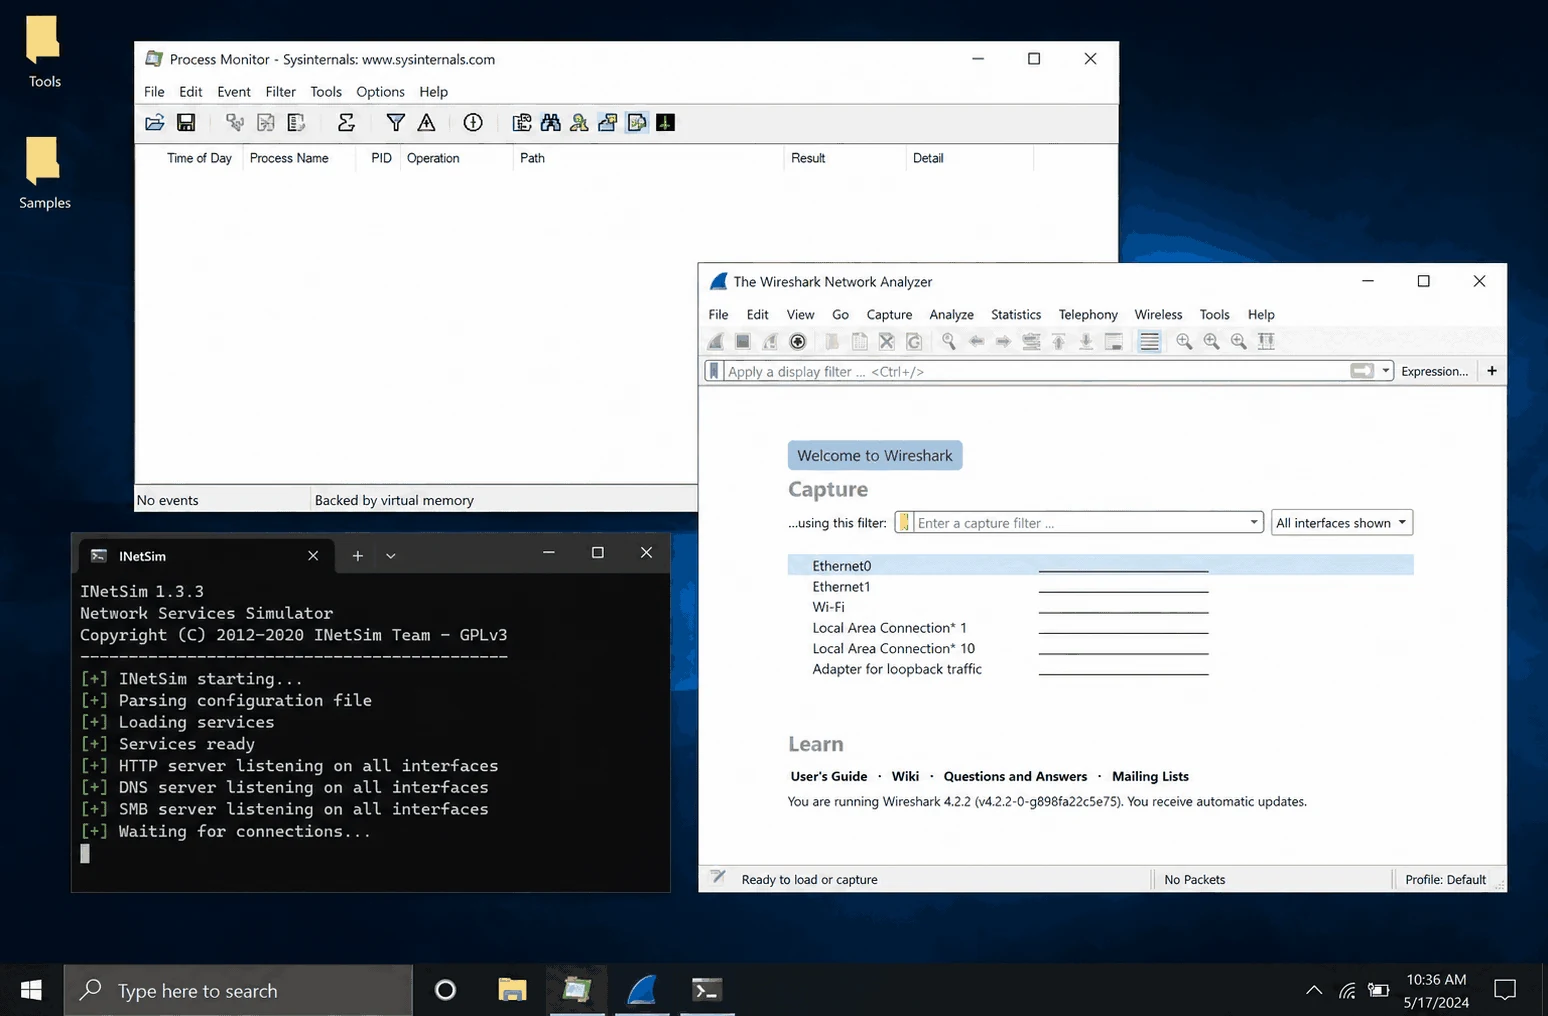
- Revert VM to clean snapshot
- Start REMnux services -- INetSim or fakedns on the services VM
- Verify connectivity -- ping REMnux from Windows VM, confirm DNS resolves
- Start Procmon -- configure filters, begin capture (Ctrl+E)
- Start Process Explorer -- arrange for visibility
- Start Wireshark -- begin capture on host-only interface
- Take Regshot snapshot -- "1st shot" for before/after comparison
- Execute the sample -- note the exact time
- Wait 3-5 minutes -- observe initial behavior (some malware has delayed execution)
- Interact if needed -- click dialog boxes, provide fake credentials
- Take Regshot 2nd snapshot -- compare with first
- Stop captures -- save Procmon (PML), Wireshark (PCAP), Regshot (HTML diff)
6. Common Pitfalls and Tips
| Pitfall | Consequence | Prevention |
|---|---|---|
| Forgetting to revert snapshot | Contaminated baseline, unreliable results | Always revert before each new sample |
| Using NAT instead of host-only | Malware reaches the real internet | Verify adapter settings before execution |
| Starting monitoring after execution | Missing initial behaviors (often the most important) | Follow the launch order strictly |
| Not waiting long enough | Missing time-delayed behaviors | Wait at least 3-5 minutes; some malware sleeps for 10+ |
| Running multiple samples without reverting | Cross-contamination between samples | One sample per snapshot cycle |
| Ignoring VM detection | Malware detects VM and changes behavior | Use anti-detection techniques (covered in advanced modules) |
MITRE ATT&CK: Dynamic analysis sandbox setup relates to detection of T1497 - Virtualization/Sandbox Evasion (malware that detects your lab) and enables observation of virtually all execution-phase techniques.