
End-to-End Behavioral Analysis Workflow
This lesson ties together everything from the previous four lessons into a complete, repeatable workflow. From the moment you receive a malware sample to the final IOC extraction and report, this is the process a professional analyst follows.
1. Phase 1: Preparation
Sample Staging
1. Compute SHA-256 of the sample before any analysis
   $ sha256sum suspicious.exe
   > a1b2c3d4e5f6...

2. Search the hash on VirusTotal and MalwareBazaar
   - If results exist: read existing reports before proceeding
   - Note: AV detection names, family labels, any behavioral reports

3. Transfer sample to Analysis VM
   - Use SCP over the isolated network, or a one-time attached ISO. **Not a shared folder** -- those stay disabled, for the reason given in A0: a shared folder is a writable path straight back to your host
   - Place in a known location: C:\malware\suspicious.exe
   - Verify hash matches after transfer
Environment Setup
1. Revert Windows Analysis VM to clean snapshot
2. Revert REMnux VM to clean snapshot
3. Verify host-only network connectivity:
   - From Windows VM: ping 10.0.0.1 (REMnux)
   - From Windows VM: nslookup test.com 10.0.0.1 (should resolve)
4. Start INetSim on REMnux: sudo inetsim
5. Start Wireshark on REMnux: capture on host-only interface
2. Phase 2: Execution & Monitoring
Tool Launch Sequence
On Windows Analysis VM (in this order):

1. Start Procmon
   → Set filter: Process Name is suspicious.exe → Include
   → Ctrl+E to begin capture

2. Start Process Explorer
   → View → Show Lower Pane (Ctrl+L)
   → Lower pane: View → DLLs

3. Start Wireshark
   → Capture on host-only adapter

4. Take Regshot 1st snapshot
   → Scan dir: C:\
   → Click "1st shot" → "Shot"

5. Save Autoruns baseline
   → File → Save → baseline.arn

6. Note the current time (for timeline correlation)

7. Execute the sample
   → Double-click or run from command prompt
   → Note exact execution time: HH:MM:SS
During Execution (3-5 Minutes)
Observe and note:
- Process Explorer: Does the malware spawn child processes?
- Procmon: Is it writing files? Modifying registry?
- Wireshark: Any DNS queries or HTTP connections?
- Desktop: Any new windows, dialogs, or visual changes?

If the malware seems dormant:
- Wait longer (some malware sleeps 5-15 minutes)
- Try interacting: click any dialog boxes that appear
- Check if it requires internet (verify INetSim is responding)
- Try running as Administrator (some malware requires elevation)
3. Phase 3: Data Collection
Stop and Save All Captures
1. Regshot: Take 2nd snapshot → Compare → Save as HTML

2. Autoruns: Compare with baseline
   → File → Compare → baseline.arn
   → Screenshot or note all GREEN entries

3. Procmon: Stop capture (Ctrl+E)
   → File → Save → suspicious_procmon.pml
   → Also export filtered view as CSV

4. Wireshark (Analysis VM): Stop capture
   → File → Save As → suspicious_local.pcap

5. Wireshark (REMnux): Stop capture
   → File → Save As → suspicious_network.pcap

6. INetSim logs: Copy from /var/log/inetsim/

7. Screenshot Process Explorer process tree
   → Tools → Process Tree for hierarchy view
4. Phase 4: Analysis & Correlation
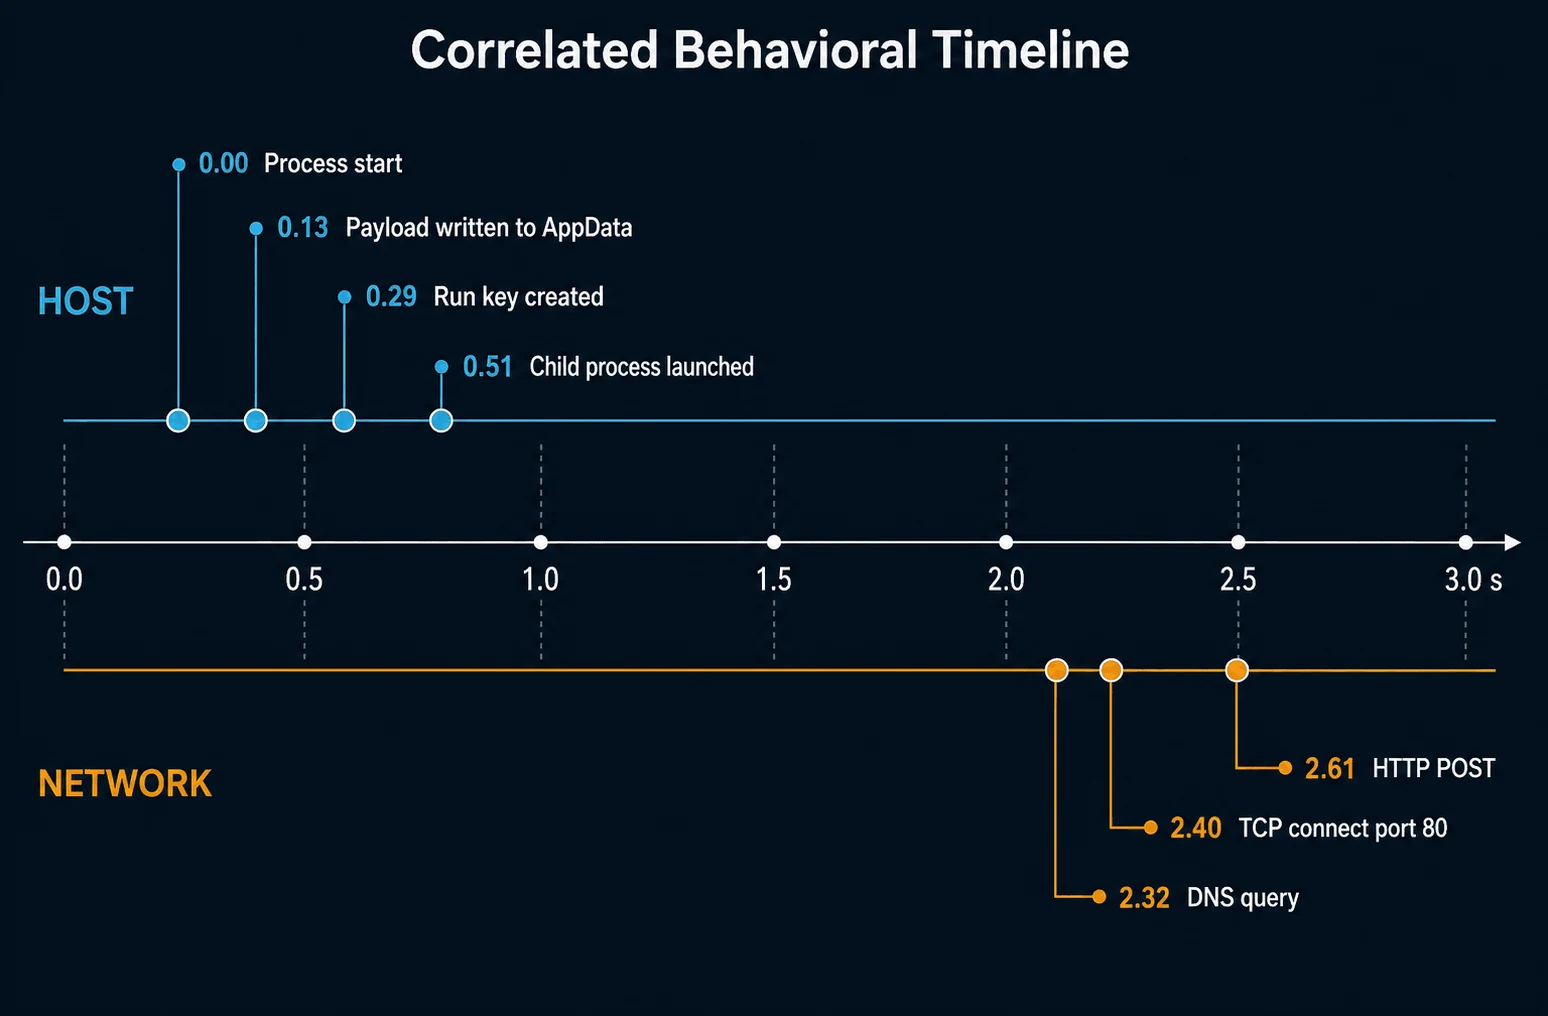
Building the Behavioral Timeline
Correlate findings across all tools using timestamps:
| Time | Source | Event | Category | IOC |
|---|---|---|---|---|
| T+0.0s | Process Explorer | suspicious.exe started (PID 5680) | Execution | SHA-256: a1b2c3... |
| T+0.5s | Procmon | CreateFile C:\Users...\Temp\brbconfig.tmp | File Drop | File path |
| T+1.0s | Procmon | WriteFile brbconfig.tmp (2,048 bytes) | File Drop | File hash |
| T+1.5s | Procmon | RegSetValue ...\Run\brbbot | Persistence | Registry key |
| T+2.0s | Wireshark | DNS query: evil-c2.com | C2 | Domain |
| T+2.5s | Wireshark | HTTP POST /gate.php | C2 | URL path |
| T+3.0s | Procmon | Process Create: cmd.exe | Execution | Child process |
| T+5.0s | Procmon | CreateRemoteThread in explorer.exe | Injection | Target PID |
Cross-Referencing Data Sources
For each finding, verify across multiple tools:

File drops:
  Procmon → Shows CreateFile + WriteFile operations (process responsible)
  Regshot → Shows the file exists in the filesystem diff
  Autoruns → Shows if the file is configured to auto-start

Registry changes:
  Procmon → Shows RegSetValue operation (exact timestamp, process)
  Regshot → Confirms the value exists in registry diff
  Autoruns → Confirms if it is a persistence mechanism

Network connections:
  Procmon → Shows TCP Connect event (process responsible)
  Wireshark (Analysis VM) → Shows packet-level detail
  Wireshark (REMnux) → Confirms traffic left the VM
  INetSim logs → Shows what services the malware accessed
Malware Behavior Classification
Based on observed behaviors, classify the sample:
| Behavior Category | Indicators Observed | Classification |
|---|---|---|
| Dropper | Writes executable to disk, executes it | Drops secondary payload |
| Downloader | HTTP GET for executable content | Downloads next stage |
| Backdoor/RAT | Periodic HTTP callbacks, command responses | Remote access tool |
| Ransomware | Mass file encryption, ransom note creation | Crypto-ransomware |
| Worm | Network scanning, SMB connections | Self-propagating |
| Info Stealer | Reads browser data, credentials files | Data theft |
| Bot | C2 check-in, command execution loop | Botnet participant |
| Rootkit | Driver loading, hooking system calls | Stealth/persistence |
5. Phase 5: IOC Extraction & Reporting
IOC Compilation Checklist
File IOCs:
  [ ] SHA-256 of original sample
  [ ] SHA-256 of all dropped files
  [ ] File names and paths used
  [ ] File sizes

Network IOCs:
  [ ] Domains queried (DNS)
  [ ] IP addresses contacted
  [ ] Full URLs (paths + parameters)
  [ ] HTTP User-Agent strings
  [ ] JA3/JA3S hashes
  [ ] Communication ports

Host IOCs:
  [ ] Registry keys created/modified
  [ ] Scheduled tasks created
  [ ] Services installed
  [ ] Mutex names created
  [ ] Named pipes created

Behavioral IOCs:
  [ ] Process tree (parent-child relationships)
  [ ] Injection techniques used
  [ ] Evasion techniques observed
  [ ] Persistence mechanisms installed
Report Template Structure
1. Executive Summary
   - Sample identification (hash, filename, file type)
   - Malware classification (dropper/RAT/ransomware/etc.)
   - Severity assessment
   - Key findings (3-5 bullet points)

2. Static Analysis Summary
   - File properties, compile timestamp, packer detection
   - Notable strings and imports
   - (Reference your Module A2 analysis)

3. Dynamic Analysis Findings
   - Environment setup (VM, tools, network config)
   - Behavioral timeline (the table from Phase 4)
   - File system changes (Regshot summary)
   - Registry changes (Regshot + Autoruns summary)
   - Network activity (DNS, HTTP, TLS summary)
   - Process behavior (process tree, injection)

4. IOC Table
   - Compiled from the IOC checklist above
   - Formatted for import into threat intelligence platforms

5. MITRE ATT&CK Mapping
   - List all techniques observed with evidence
   - Example: T1547.001 - Registry Run Keys (Regshot showed new Run value)

6. Recommendations
   - Detection signatures (YARA, Snort/Suricata, Sigma)
   - Blocking actions (firewall rules, DNS sinkholing)
   - Remediation steps for infected systems
6. Online Sandbox Integration
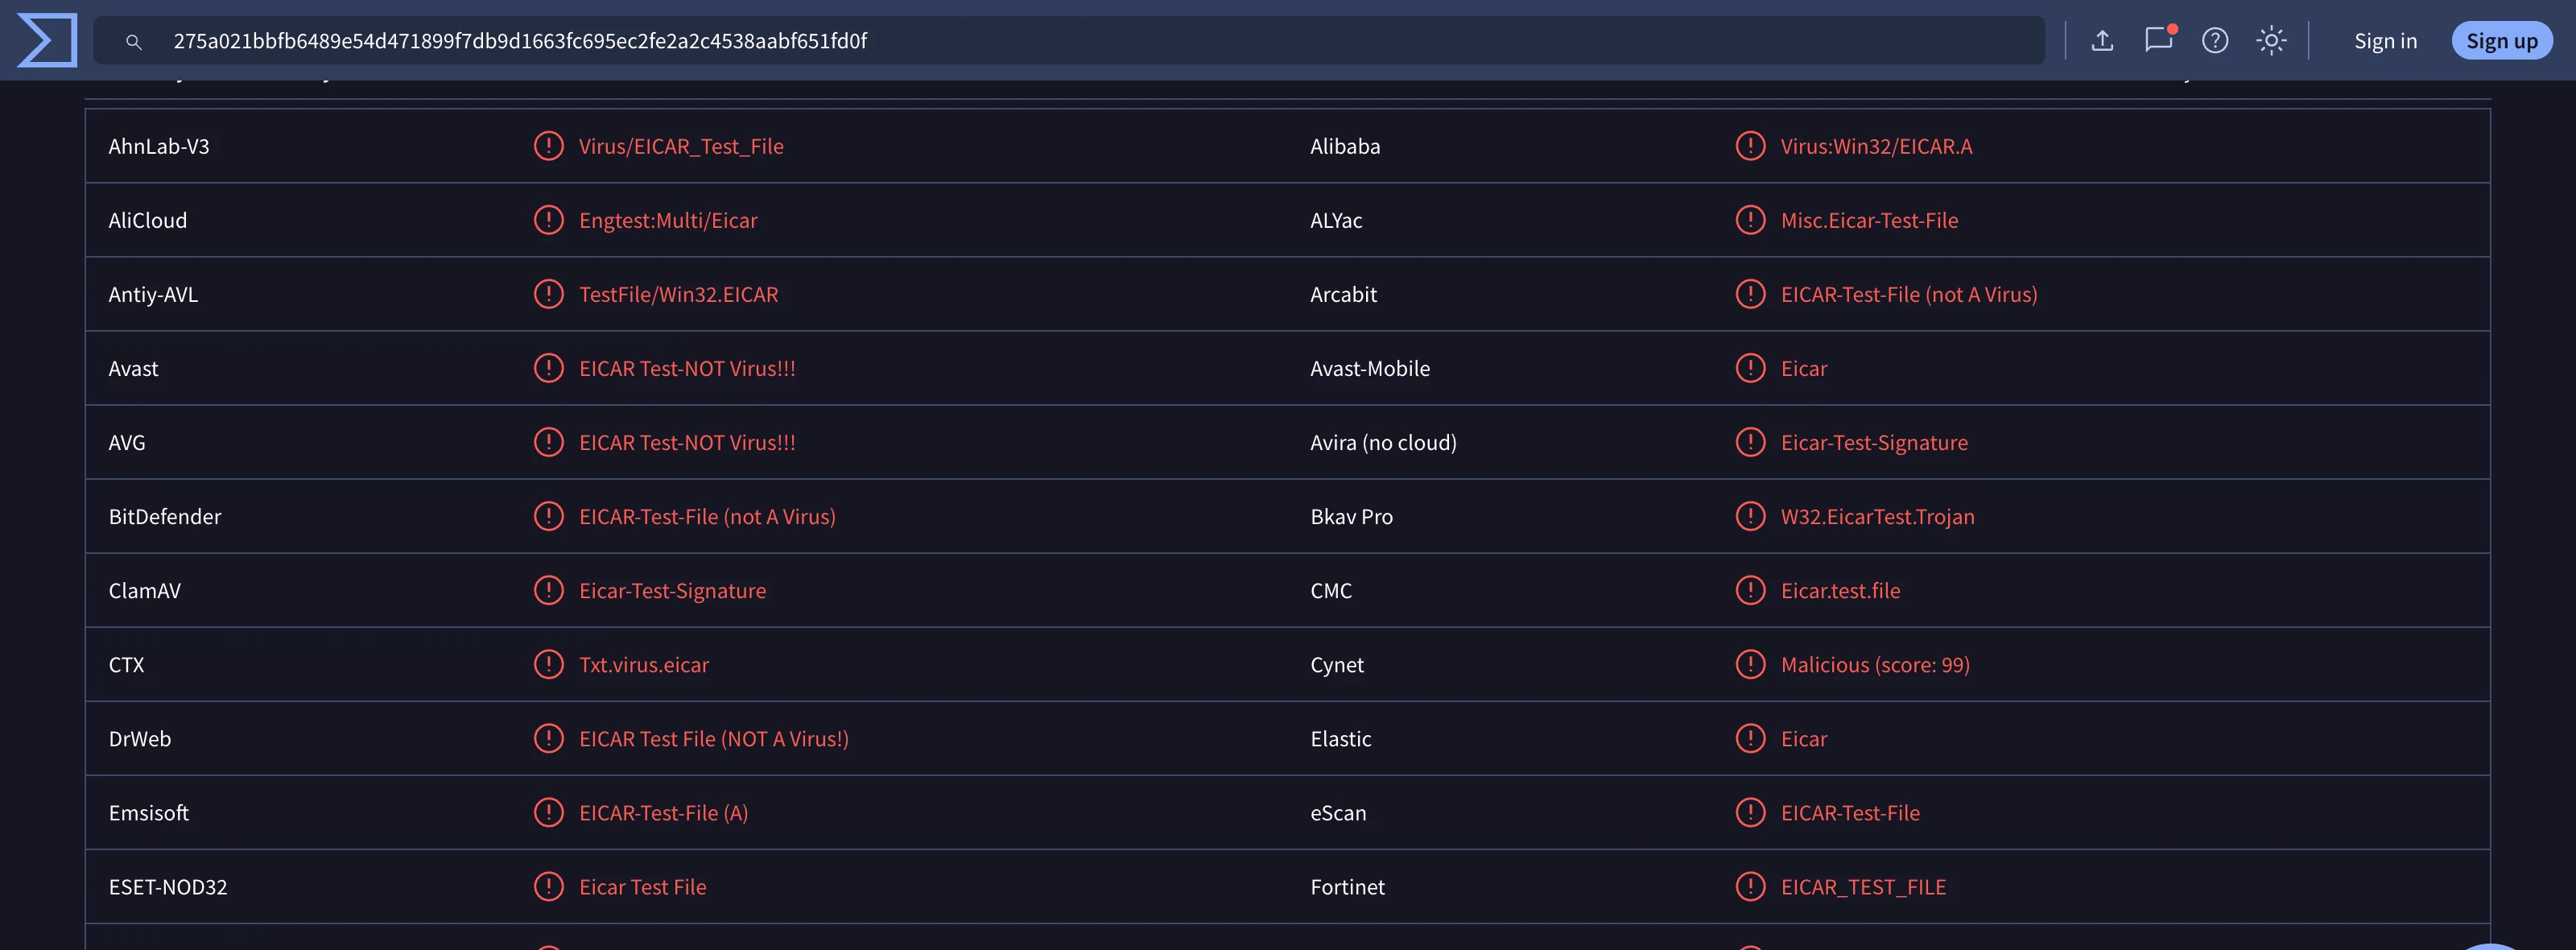
Online sandboxes complement your manual analysis and may reveal behaviors you missed:
When to Submit to Online Sandboxes
| Scenario | Action | Service |
|---|---|---|
| Quick triage of unknown file | Search hash first, then submit | VirusTotal, Triage |
| Need interactive analysis | Use interactive sandbox | ANY.RUN |
| Need multi-platform testing | Submit for cross-platform analysis | Joe Sandbox |
| Need detailed behavioral report | Submit for deep analysis | Hybrid Analysis |
| Need payload/config extraction | Use extraction-focused sandbox | CAPE, Triage |
OPSEC Reminder
Before submitting to ANY public sandbox:

1. Is this sample confidential or client-specific?
   → YES: Use private/local sandbox only (CAPE, local Cuckoo)
   → NO: Proceed with public submission

2. Does the sample contain identifying information?
   → Check for embedded IPs, domains, credentials
   → Strip metadata if possible

3. Are you authorized to share this sample?
   → Verify with your incident response lead
   → Some IR engagements have strict NDA requirements

Rule: Always search by hash FIRST. Only upload if no results exist.
Comparing Local vs. Sandbox Results
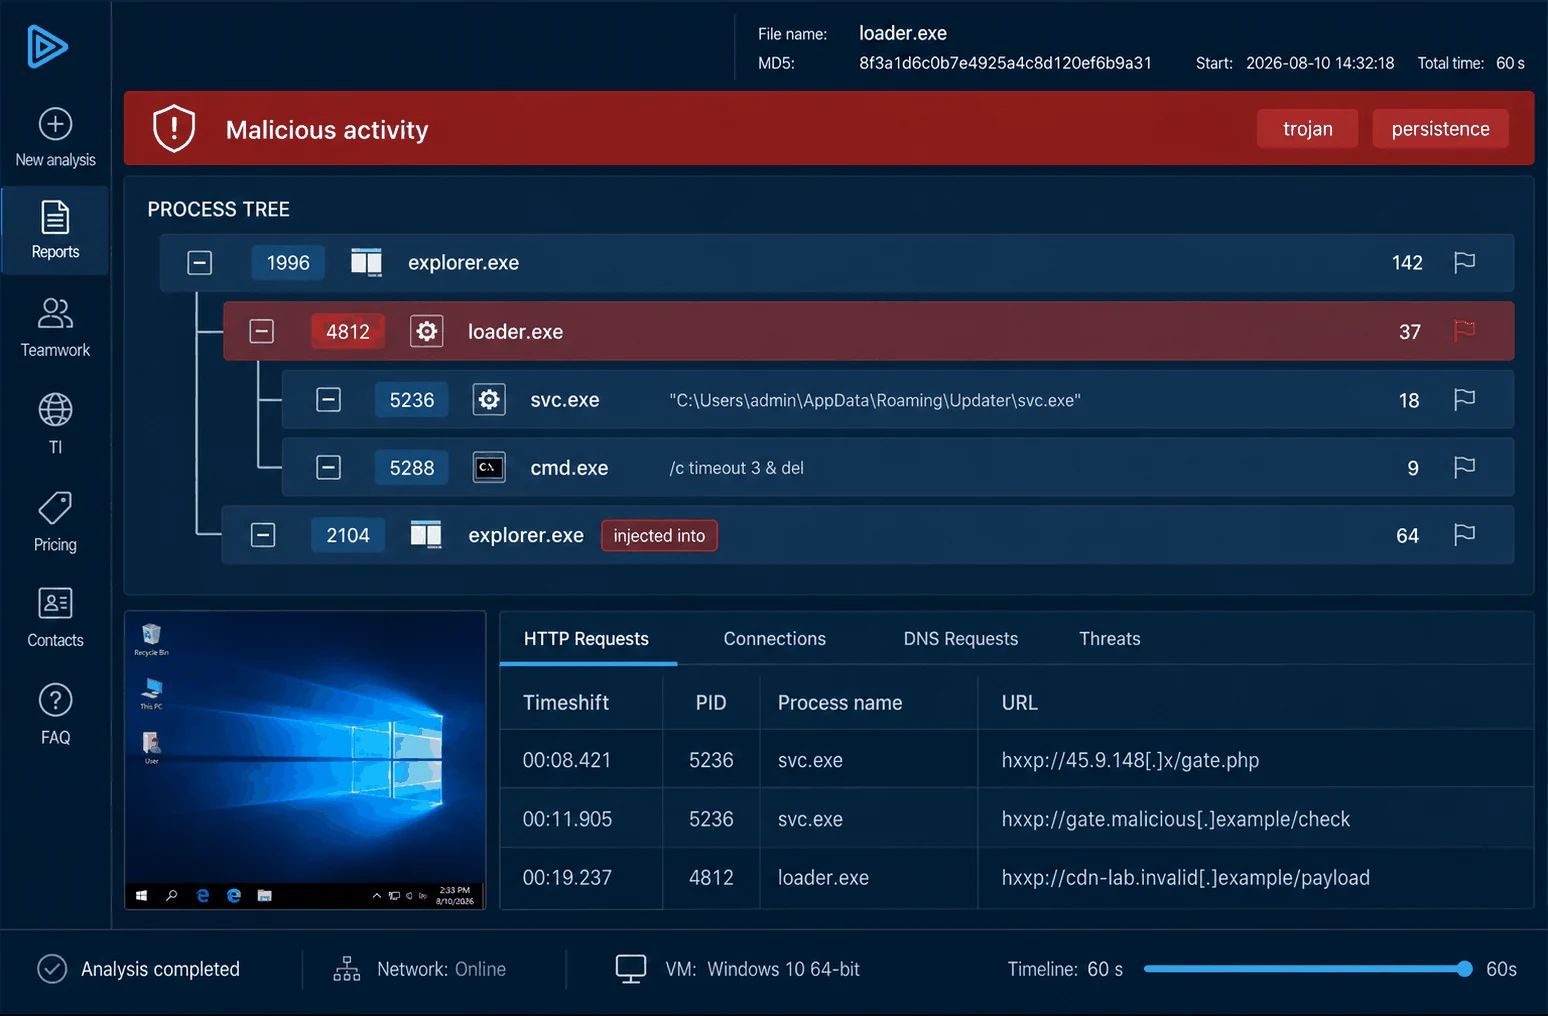
After receiving a sandbox report, compare:

1. Did the sandbox observe the same network IOCs?
   → If not: sandbox may have detected VM and changed behavior
   → Or: malware uses different C2 per execution

2. Did the sandbox find additional dropped files?
   → Some sandboxes run longer than your 3-5 minute window
   → Download and hash any new artifacts

3. Did the sandbox trigger different AV detections?
   → Compare family names across engines
   → Use majority consensus for classification

4. Did the sandbox extract malware configuration?
   → CAPE and Triage often extract C2 configs automatically
   → Compare extracted C2 with your network captures
Common Pitfall: Do not treat sandbox reports as a replacement for your own analysis. Sandboxes have fixed execution times, limited interaction, and may miss behaviors that require specific triggers. Your manual analysis + sandbox report together provide the most complete picture.
MITRE ATT&CK: The complete behavioral workflow maps observed behaviors across all ATT&CK tactics: Initial Access through Impact. Each technique you document strengthens detection engineering and threat intelligence.